Sunday, July 20, 2008

Dr Joe Trodahl on Radio NZ with Veronika Meduna

Here’s a voice from the past, my old thesis supervisor at Victoria University, Joe Trodahl on Radio NZ speaking about new materials that combine ferroelectric and ferromagnetic properties. Joe’s got a great accent with that wonderful Alaskan sound.

http://www.radionz.co.nz/audio/national/ocw/2008/07/17/new_materials

Tuesday, July 15, 2008

Label Cloud in Blogger

Great, just found how to do it. Seems to work fine with Blogger labels. Go to http://phy3blog.googlepages.com/Beta-Blogger-Label-Cloud.html for details.

Monday, July 14, 2008

More Adventures with Innovation Blogging

So, as I reported recently I’ve been working on an internal blog to report the clever stuff we do in the IT shared service line within the corporate where I work. The reason behind doing it is of course to raise awareness of the great stuff I see the broader team delivering each week. This might be grass roots incremental or possibly (hopefully!) ground breaking and disruptive.

Now I’m getting blog postings, I’ve managed to deliver a KPI on the Sharepoint list hosting the blog, I’ve worked through how to create a chart to make progress through the year obvious, but now I want to get a summary of the blog postings on pages elsewhere in the Sharepoint server.

Unfortunately, while I have a large team of developers, the reality is they’re all fully busy so I’ve had to work through this problem myself.

Here’s some guidance for others doing the same. First off quick note to say I was surprised at how hard it was. Still, I’ve got there.

So, to get the blog posts and re-display them elsewhere I used Sharepoint Designer. This gives you the ability to place a DataView in a webpart on any page. It turns out the DataView is the Swiss Army knife of Sharepoint programming (at least when you’re using Sharepoint Designer). This control allows you perform an XSL transform on a data source and display the results. The query is represented using CAML and the best reference to help me with my problem was a posting on the Sharepoint Designer blog. Look for the entry on the CAML query. My select command turned out like this:

selectcommand="<View><Query><OrderBy><FieldRef Name='PublishedDate' Ascending='FALSE'/></OrderBy><Where><Geq><FieldRef Name='PublishedDate'/><Value Type='DateTime'><Today OffsetDays='-30'/></Value></Geq></Where></Query></View>"


The next problem is formatting the output. If you don’t format the output you’ll get HTML tags that will disrupt the rest of the page.


So, in the end I did something like the following. Note that I used some XSL to remove the markup where it occurred. I got that from http://blogs.pointbridge.com/Blogs/morse_matt/Pages/Post.aspx?_ID=37.


   1: <xsl:template name="RemoveHtmlTags">


   2:     <xsl:param name="html"/>


   3:         <xsl:choose>


   4:             <xsl:when test="contains($html, '&lt;')">


   5:             <xsl:value-of select="substring-before($html, '&lt;')"/>


   6:            <!-- Recurse through HTML -->


   7:            <xsl:call-template name="RemoveHtmlTags">


   8:              <xsl:with-param name="html" select="substring-after($html, '&gt;')"/>


   9:            </xsl:call-template>


  10:          </xsl:when>


  11:          <xsl:otherwise>


  12:            <xsl:value-of select="$html"/>


  13:          </xsl:otherwise>


  14:        </xsl:choose>


  15: </xsl:template>


  16:     


  17: <xsl:template name="dvt_1.rowview">


  18:     <xsl:variable name="pureTextBody">


  19:         <xsl:call-template name="RemoveHtmlTags">


  20:               <xsl:with-param name="html" select="substring(@Body,0,250)" />


  21:         </xsl:call-template>


  22:     </xsl:variable>


  23:  


  24:     <tr>


  25:         <xsl:if test="position() mod 2 = 1">


  26:             <xsl:attribute name="class">ms-alternating</xsl:attribute>


  27:         </xsl:if>


  28:         <xsl:if test="$dvt_1_automode = '1'" ddwrt:cf_ignore="1">


  29:             <td class="ms-vb" width="1%" nowrap="nowrap">


  30:                 <span ddwrt:amkeyfield="ID" ddwrt:amkeyvalue="ddwrt:EscapeDelims(string(@ID))" ddwrt:ammode="view"></span>


  31:             </td>


  32:         </xsl:if>


  33:         <td class="ms-vb">


  34:             <a href="/CleverStuff/Lists/Posts/Post.aspx?ID={@ID}"><xsl:value-of select="@Title"/></a>


  35:         </td>


  36:         <td class="ms-vb">


  37:             <xsl:value-of select="ddwrt:FormatDate(string(@PublishedDate), 1033, 5)"/>


  38:         </td>


  39:         <td class="ms-vb">


  40:             <xsl:value-of select="$pureTextBody" disable-output-escaping="yes" /></td></tr>


  41: </xsl:template>


  42: l:stylesheet>


Now, I still have a problem. I’m getting an error message at the bottom of the (successfully) displayed list. The message is “An error occurred processing the data view. The XslText property is empty.”. Any ideas???? This Microsoft KB article has some information but it’s for Sharepoint 2003. I might have to get one of the dev team onto it:)

Update: 16 July

Doh! Figured the problem out - I had an extra DataView webpartzone inserted. I think this is an outcome of the sluggish performance of Sharepoint Designer. You tend to click too many times when you're inserting controls...
Wednesday, July 09, 2008

Update on the List Activity Viewer

Just a quick note regarding deployment of the activity grapher I described last week. This is now deployed and working a treat but I did have a minor problem getting it going. Turns out our current production implementation of sharepoing isn’t using the delegation model for Excel Services security. Instead we’re using the trusted subsystem approach (typical for a farm). In this instance to get the UDF going I just needed to remove the impersonation I was using for my dev/test environment.

Friday, July 04, 2008

Great Day

What a great day! A month ago almost exactly, I spoke at the FSI Media Technology and Innovation Conference and mentioned the importance of internal selling in a corporate. As an example of the opportunities we often miss I mentioned that I have a development team sitting in an open plan pod next to the CEOs pod (a remarkable fact in itself for a corporate of our size!). David, the team lead, had recently shown me his real time graphs of call centre activity displayed using Microsoft’s new WPF technology. They looked fantastic and the obvious thought was to maximise the impact by making available a big screen that ensured CEO, GMs all and sundry could see the impressive output from these monitoring programs. All I had to do was make a big screen available.

Well, it took a month but finally we got a 40” screen up there and yes, they had the desired impact. Before leaving work today we had a cluster of people ranging from analysts through our EXT team admiring the graphs and watching them turn from green to red and back as the metrics progressively changed in real time.

Success and many thanks to David!

Tuesday, July 01, 2008

Graphing Sharepoint List Activity

Here’s an interesting challenge that I’ve had over the last few days. At work we’re beginning to use sharepoint (MOSS/WSS) more and more as a tool within our office environment. It’s used for document/record management; it’s used for team workplaces; it’s used for hosting business processes; heck, it’s used for all sorts of things. In my case I’ve been using it lately to track the innovative ideas and deliverables that our IT shared service line are coming up with. I bug them for their clever stuff and either they post an entry into a blog, or I do it for them.

Now, here’s the problem. The blog looks great and I have a KPI web part showing blog items submitted over the last 2 weeks. I even have separate KPIs for different team’s submissions (identified by the category of the blog post), but what I really wanted was a graph of activity over the weeks. Do you think this would be easy? Well no!

You can easily add a web part to show an Excel report using Excel Services at the top of the blog. You can access sharepoint list data in an Excel workbook. The tricky part is that when you go to publish it into Excel Services you find an error message saying that retrieving data from sharepoint lists isn’t supported yet! A search on the net tells you that you need to create a UDF. I read somewhere that Excel Services is a ‘version 1’ product and apparently it doesn’t support everything you’d expect. Hmm, consuming a sharepoint list was one thing I definitely was expecting Excel Services to be capable of doing. Nevermind…

OK - back on track, so there is some sample code out there (eg check http://msdn.microsoft.com/en-us/library/bb267252.aspx) but explanations are fairly limited. So here’s a quick run down of what I’ve managed to do.

Firstly, borrow someone else’s code (eg from the link above):) Then iterate through items in the sharepoint list and accumulate across a number of previous week counters (or maybe put into a collection and try using linq?) eg:

   1: // Create an object array to return to Excel and initialise values


   2: toExcel = new object[weekCount, 2];


   3: for (int i = 0; i < weekCount; i++)


   4: {


   5:     toExcel[i, 0] = i;


   6:     toExcel[i, 1] = 0;


   7: }


   8:  


   9: // two approaches to try


  10: // 1: iterate through all list items and increment week activity counters when in range; or


  11: // 2: use linq


  12:  


  13: CultureInfo ci = new CultureInfo(CultureInfo.CurrentCulture.Name, false);


  14: int thisWeek = ci.Calendar.GetWeekOfYear(DateTime.Now, CalendarWeekRule.FirstDay, DayOfWeek.Monday);


  15:  


  16: // Iterate through SPListItems in the view.


  17: foreach (SPListItem currVal in values)


  18: {


  19:     // get created date field


  20:     // !** might need to set DateTimeFormatInfo appropriately 


  21:     // use Calendar.GetWeekOfYear (from System.Globalization) to determine difference in weeks from today


  22:     // or perhaps SPIntlCal.GetWeekNumber from Microsoft.Sharepoint.Utilities


  23:  


  24:     SPField field = currVal.Fields.GetFieldByInternalName("Created");


  25:     DateTime created = DateTime.Parse(field.GetFieldValueAsText(currVal[field.Id]));


  26:  


  27:     // find week number for today


  28:     // then find week number of list item


  29:     // subtract and accumalate appropriate counter


  30:     // if week difference < max number of weeks previous


  31:     int createdWeek = ci.Calendar.GetWeekOfYear(created, CalendarWeekRule.FirstDay, DayOfWeek.Monday);


  32:     int weeksPast = thisWeek-createdWeek;


  33:  


  34:     if (weeksPast < weekCount)


  35:     {


  36:         toExcel[weeksPast, 1] = (int)toExcel[weeksPast, 1] + 1;


  37:     }


  38:     else


  39:     {


  40:         // must be the first few weeks of a new year


  41:  


  42:     }


  43: }


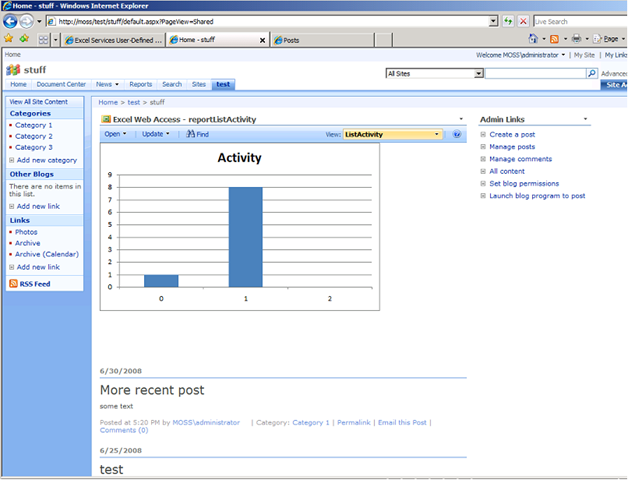
Then return to Excel, generate the chart and post back into Excel Services so you get something like the screenshot below (all test data of course).


image


In this case there were 8 posts in the previous week, 1 post in the current week, and none going back 2 weeks.


One thing to keep in mind with the code I put up above – I didn’t put in any logic to handle week intervals around the change of one year to another – in this instance I think you’ll need to add 52. You can grab some sample code from my public skydrive folder: ListActivityInWeeks.zip-download. Suggestion: grab a copy of Cum Grano Sails Professional Excel Services book.


Update 2 July 08: Code changed slightly from snippet above - check download for difference - basically just to add 52 if week difference goes negative...