Here’s an interesting challenge that I’ve had over the last few days. At work we’re beginning to use sharepoint (MOSS/WSS) more and more as a tool within our office environment. It’s used for document/record management; it’s used for team workplaces; it’s used for hosting business processes; heck, it’s used for all sorts of things. In my case I’ve been using it lately to track the innovative ideas and deliverables that our IT shared service line are coming up with. I bug them for their clever stuff and either they post an entry into a blog, or I do it for them.
Now, here’s the problem. The blog looks great and I have a KPI web part showing blog items submitted over the last 2 weeks. I even have separate KPIs for different team’s submissions (identified by the category of the blog post), but what I really wanted was a graph of activity over the weeks. Do you think this would be easy? Well no!
You can easily add a web part to show an Excel report using Excel Services at the top of the blog. You can access sharepoint list data in an Excel workbook. The tricky part is that when you go to publish it into Excel Services you find an error message saying that retrieving data from sharepoint lists isn’t supported yet! A search on the net tells you that you need to create a UDF. I read somewhere that Excel Services is a ‘version 1’ product and apparently it doesn’t support everything you’d expect. Hmm, consuming a sharepoint list was one thing I definitely was expecting Excel Services to be capable of doing. Nevermind…
OK - back on track, so there is some sample code out there (eg check http://msdn.microsoft.com/en-us/library/bb267252.aspx) but explanations are fairly limited. So here’s a quick run down of what I’ve managed to do.
Firstly, borrow someone else’s code (eg from the link above):) Then iterate through items in the sharepoint list and accumulate across a number of previous week counters (or maybe put into a collection and try using linq?) eg:
1: // Create an object array to return to Excel and initialise values
2: toExcel = new object[weekCount, 2];
3: for (int i = 0; i < weekCount; i++)
4: { 5: toExcel[i, 0] = i; 6: toExcel[i, 1] = 0; 7: } 8: 9: // two approaches to try
10: // 1: iterate through all list items and increment week activity counters when in range; or
11: // 2: use linq
12: 13: CultureInfo ci = new CultureInfo(CultureInfo.CurrentCulture.Name, false);
14: int thisWeek = ci.Calendar.GetWeekOfYear(DateTime.Now, CalendarWeekRule.FirstDay, DayOfWeek.Monday);
15: 16: // Iterate through SPListItems in the view.
17: foreach (SPListItem currVal in values)
18: {19: // get created date field
20: // !** might need to set DateTimeFormatInfo appropriately
21: // use Calendar.GetWeekOfYear (from System.Globalization) to determine difference in weeks from today
22: // or perhaps SPIntlCal.GetWeekNumber from Microsoft.Sharepoint.Utilities
23: 24: SPField field = currVal.Fields.GetFieldByInternalName("Created");
25: DateTime created = DateTime.Parse(field.GetFieldValueAsText(currVal[field.Id])); 26: 27: // find week number for today
28: // then find week number of list item
29: // subtract and accumalate appropriate counter
30: // if week difference < max number of weeks previous
31: int createdWeek = ci.Calendar.GetWeekOfYear(created, CalendarWeekRule.FirstDay, DayOfWeek.Monday);
32: int weeksPast = thisWeek-createdWeek;
33: 34: if (weeksPast < weekCount)
35: {36: toExcel[weeksPast, 1] = (int)toExcel[weeksPast, 1] + 1;
37: }38: else
39: {40: // must be the first few weeks of a new year
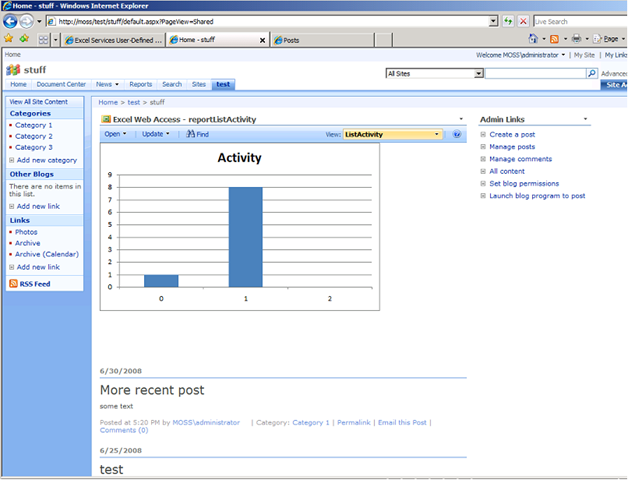
41: 42: } 43: }Then return to Excel, generate the chart and post back into Excel Services so you get something like the screenshot below (all test data of course).
In this case there were 8 posts in the previous week, 1 post in the current week, and none going back 2 weeks.
One thing to keep in mind with the code I put up above – I didn’t put in any logic to handle week intervals around the change of one year to another – in this instance I think you’ll need to add 52. You can grab some sample code from my public skydrive folder: ListActivityInWeeks.zip-download. Suggestion: grab a copy of Cum Grano Sails Professional Excel Services book.
Update 2 July 08: Code changed slightly from snippet above - check download for difference - basically just to add 52 if week difference goes negative...

1 comment:
Post a Comment